Function · KPI dashboards Built
A Reporting section in the product, built today: scan quality with predictive error trends, 3D traffic and movement heatmaps on the digital twin scene, ASRS density with forecasts, stock availability, and inbound/outbound peaks. Plus a live landing dashboard, five area dashboards, and threshold alerts delivered by email and webhook.
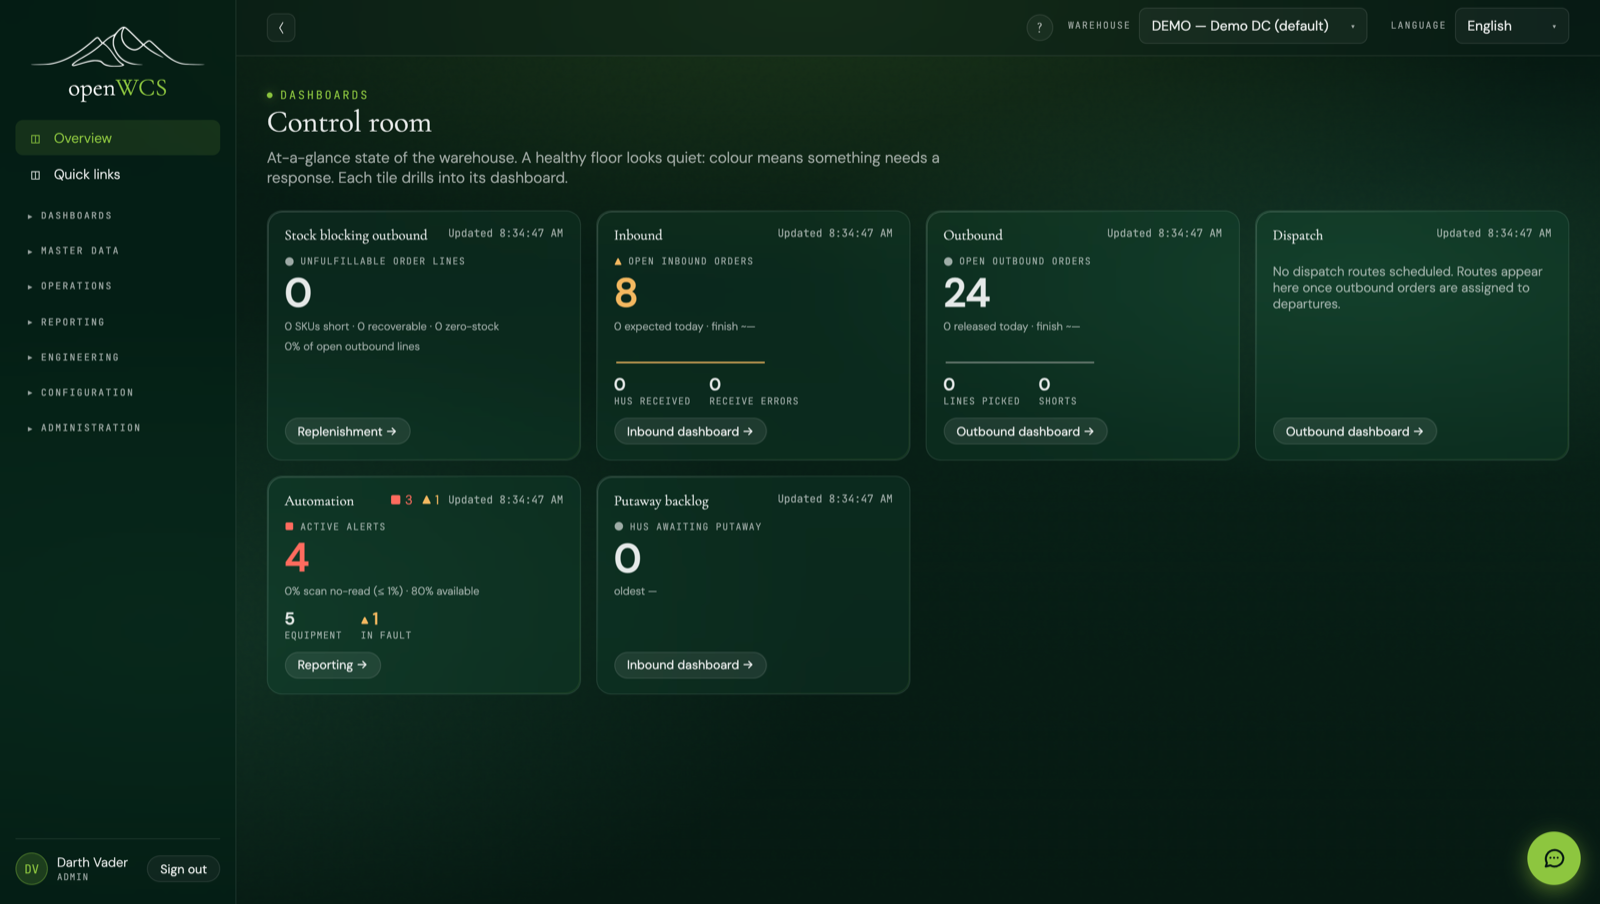
✓ Built: the Reporting section ships today in the openWCS UI (Material Flow, ASRS, Stock, Inbound, Outbound), plus a live landing dashboard, five area dashboards, SLA heroes, a full-screen andon board, an alert-system-health view, and threshold alerting with email and webhook delivery. Demo mode seeds the dashboards and alerts so they show live on day one.
Built today
The services collect the numbers as they happen: per-scan counters and daily density snapshots, with history accumulating from the day you deploy. The Reporting section turns them into five screens: Material Flow, ASRS, Stock, Inbound and Outbound.
Scans, no-reads and unknowns per scan point per day, plus a "scanners needing attention" table that flags rising error-rate trends, so a dying reader gets fixed before it stops the line.
A 3D conveyor traffic heatmap rendered on the same scene as the digital twin, plus transit-time p50/p95 per day, so the busy segments and the slow days stand out at a glance.
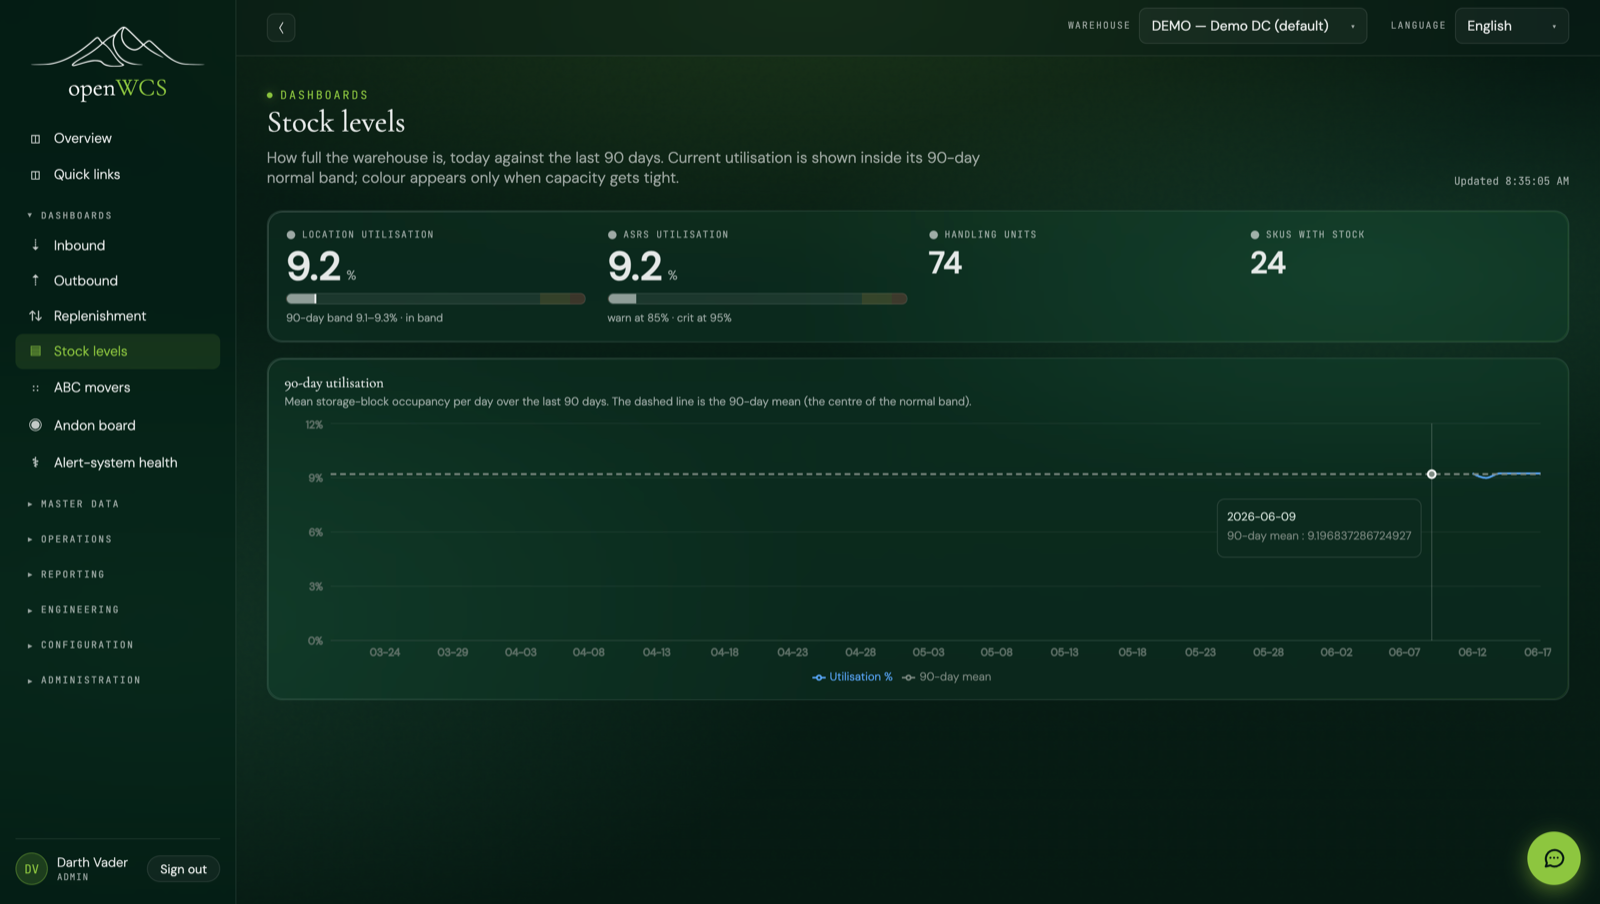
Storage density per block in figures and percent, with 90 days of history from daily snapshots and a 14-day weekday-seasonal forecast drawn as a dashed continuation of the curve.
A 3D rack-cell movement heatmap shows which cells churn and which sleep, and storage movements are broken down per device, so load imbalance is visible, not guessed.
Per-SKU quantities split into available, allocated and unavailable, so what can actually be promised is never a guess.
Expected vs started vs active orders, per-day values over 90 days, and a 24-hour day map that shows exactly when the peaks hit.
Built in the latest epic
The reporting layer grew where it pays off: from numbers you read to a live landing board, area dashboards, and threshold alerts that reach you by email and webhook.
Built: a service evaluates the dashboard metrics against configurable thresholds every minute, opens warning and critical alerts when a limit is breached, clears them when the metric recovers, and delivers each one by email and webhook.
Built: a live landing dashboard with state-aware heroes (a big number, a target bar and a sparkline, coloured only when something needs attention) and five area dashboards (inbound, outbound, replenishment, stock, and ABC movers with a Pareto curve). Outbound now carries SLA heroes (on-time-to-cutoff, cycle time); ABC risers and fallers compare trailing 14 days to 90 days. Thresholds are edited in Settings.
Built: a full-screen andon board for the control room (critical first, a calm all-clear when nothing is open) and an alert-system-health screen that measures the alarm load itself (active by severity, opened versus cleared per day, chattering and stale alerts), the ISA-18.2 way to keep alerts actionable. Turn demo mode on and the dashboards and alerts seed themselves with realistic data.
At a glance
  live collection  (per-scan counters · daily density snapshots · area aggregates)   (built)
        │  history accumulates from deployment day
        ▼
  Reporting section  ── Material Flow · ASRS · Stock · Inbound · Outbound          (built)
        │
  Dashboards  ── landing state heroes · inbound · outbound · replenishment · stock · ABC   (built)
        │  + SLA heroes · dock-to-stock · windowed ABC risers/fallers
        ▼
  Alerting  ── per-minute evaluator · email + webhook · andon board · alert-system health   (built)
        │
  Demo mode  ── seeds and clears all dashboard + alert sample data                         (built)
See it yourself
The Reporting section ships in the open-source UI today. Open the live demo and walk the five screens, from scan quality to the 3D heatmaps.